Historical chart of the United States of America


History Shorts 19
This is number 19 in the series of historical "shorts" contributed by members of Audlem & District History Society under the editorship of Jeremy Nicholls.
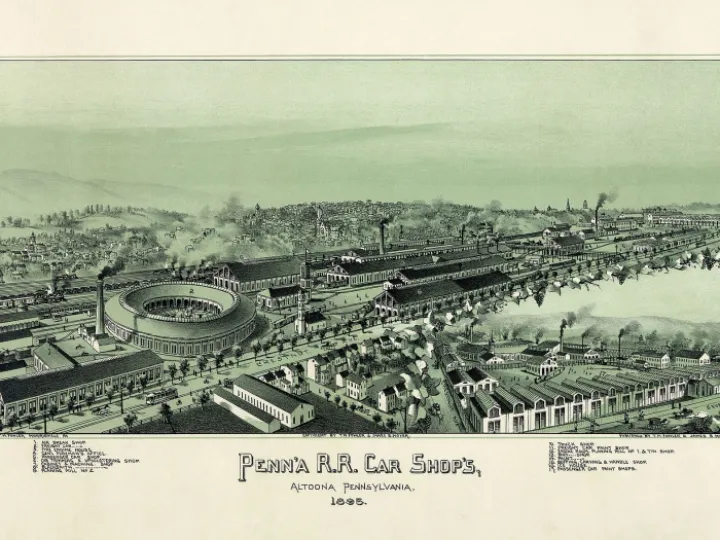
My grandfather, Edgar Worthington, was apprenticed at the London and North Western Railway's Crewe Works as a mechanical engineer. In 1881 he went to Altoona, Pennsylvania to work in the workshops of the Pennsylvania Railroad. He returned to Crewe in 1883 and in 1885 he was appointed as Chief Assistant Engineer at Beyer and Peacock in Manchester.
In 1888 his school published a volume of "miscellaneous articles contributed by old boys". Edgar Worthington's contribution was entitled "Historical Chart of the United States of America".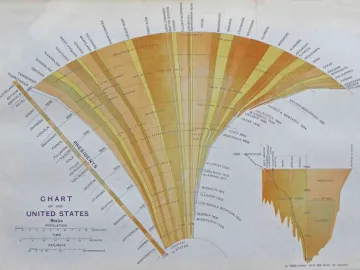 He starts his explanation of the chart by saying that maps and pictures can convey knowledge more readily than "the more tedious channel of reading". So he writes, "It is with the object of showing at a glance as much as possible of the history and growth of the United States during the last one hundred years that I have prepared the accompanying chart." It involved looking at "many columns of dreary statistics".
The chart has faded and lost the original colours. The print is small so please zoom-in to read the details that interest you.
Main diagram – The mushroom shape shows the population expansion 1790-1880. "The thirteen original states are seen at the lower end of the fan-shaped diagram" and the newer states are on the right with the dates of their birth. A few historical notes are added more or less where the events took place and the presidents are named on the left. Lincoln did not get far into his second 4-year term.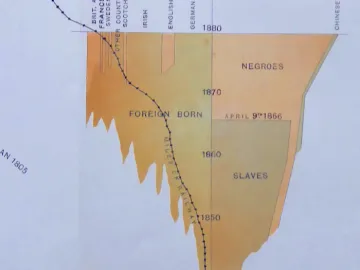 Smaller diagram (bottom right of main diagram) – This has two sides. On the left side it shows the origins of the foreign-born immigrants from 1840 to 1880. Note the large number of Irish and German immigrants. It also shows the development of the railways from 23 miles in 1830 to 136,195 miles in 1880.
On the right it shows "the simple and pathetic history of the exiled negro race with their one historical event, the Emancipation Act of April 9th, 1866". There is a slither on the right edge, "representing all that is left of the Indian tribes".
Population, ethnicity and slavery are hot topics at the moment. If the present population was added to the mushroom with the same scale, it would be over six times as wide!
Edwin Hill


Get In Touch
AudlemOnline is powered by our active community.
Please send us your news and views using the button below:
Email: editor@audlem.org